- Excel VBA
- Data Analytics
- Reservoir Engineering
Evaluation of Economic Potential of the Delaware Basin
Situation: Evaluate a section of the Delaware Basin in terms of economic potential and develop an aerial map to determine sweet spots.
Task: Analyze production data and develop a NPV/acre heat map.
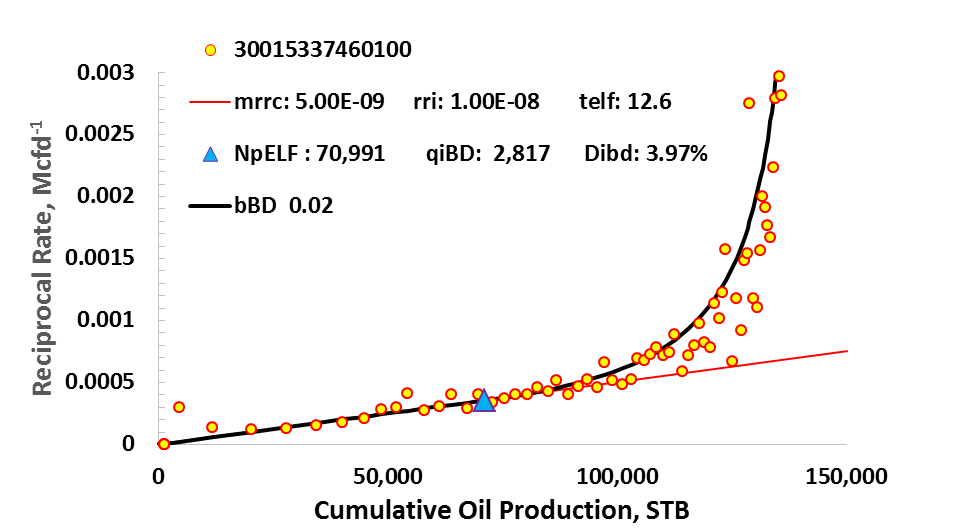
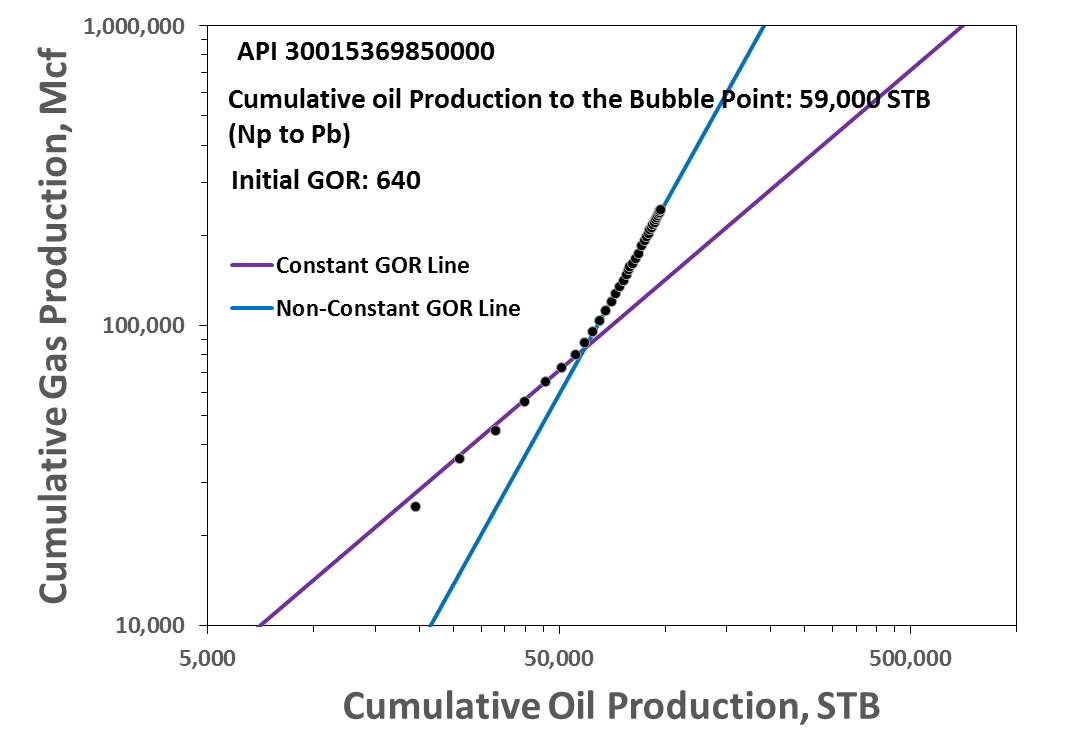
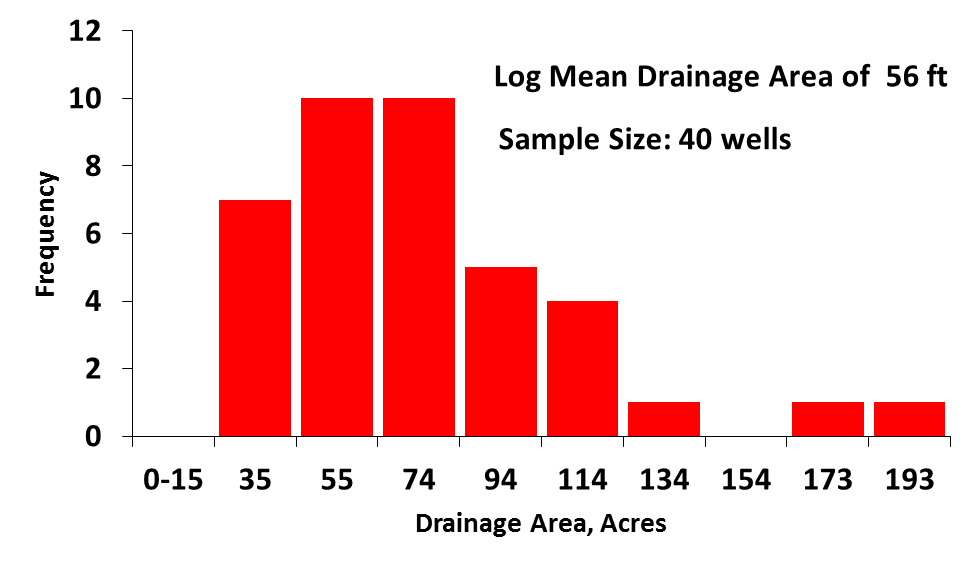
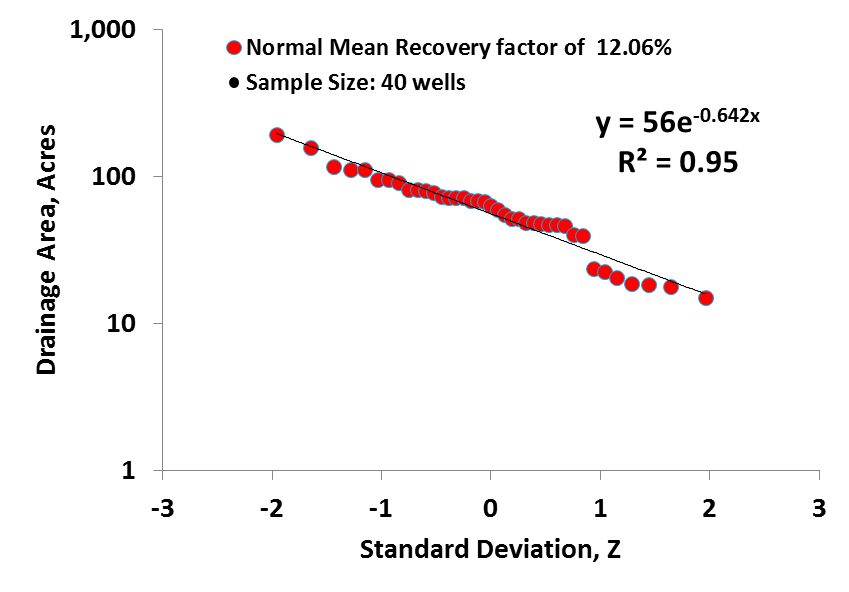
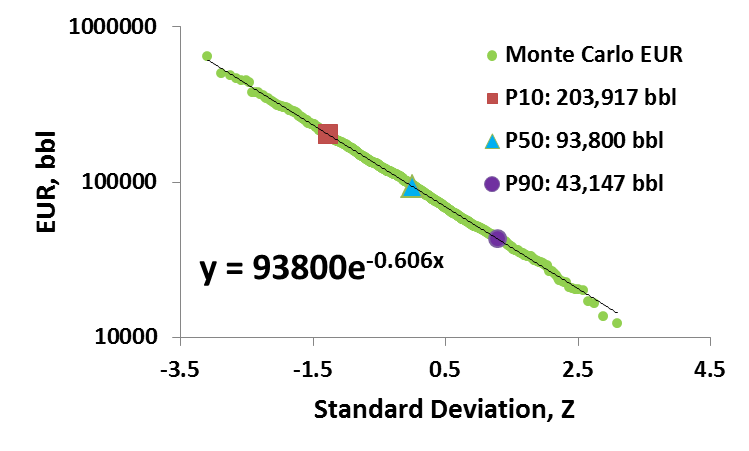
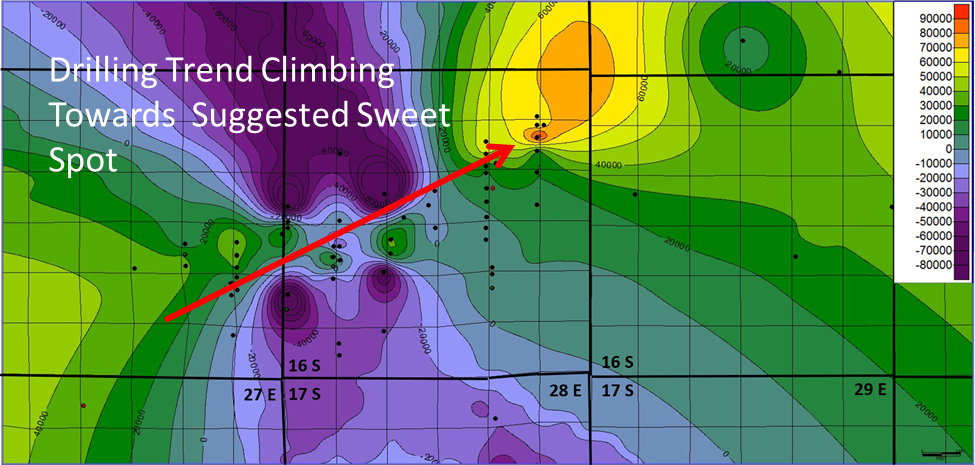
Action: Determined EUR’s and drainage areas through decline curve analysis to get NPV/acre. For wells where there was a lack of information, stochastic estimate using distributions was applied. Using this information from 72 wells, an aerial map was developed.
Result: Determined profitable acreage from the analysis. The results were validated by the drilling trend. Group received 2nd highest grade in the class out of 24 teams.